The role of urban trees in reducing land surface temperatures in European cities
Schwaab, Meier, Mussetti, Seneviratne, Bürgi & Davin · Nature Communications 12:6763 (2021) · CC BY 4.0
Fully checked against the PDF · 2026-11-21
Inventory written page by page from the PDF text layer; figures read from rendered pages. Machine check: every quote found on its stated page, coverage in both directions, on-screen numbers matched to the inventory, reference list 1-84 continuous.
Reviewer: Build agent, page by page against the PDF
- Quotes found on their stated page: 222 of 222
- Spoken sentences with a source: 76 of 76 (2 transitions without scientific content)
- Inventory entries with a place in the lesson: 224 of 224
- 224 inventory entries on 11 pages; 2 located by figure region instead of a quote.
- 1 marked unclear, 4 external supplements not checked, 0 open.
- 78 spoken sentences: 76 with sources, 2 transitions without scientific content.
- 20 on-screen numbers matched to their inventory entry.
Keyboard: Space play/pause · ← → 5 s · N P scene · M sound · C captions
Pause any time and ask a question. Answers are grounded in this paper and labelled by where they come from; citations open the original PDF.
Where each part of the paper lives
224 inventoried passages, figures, formulas, footnotes and references. Every one has a place; click any entry to see it in the PDF.
Intro15Explained in the short animated intro
Chapter74Explained in a chapter of the full video
Detail view40Readable in a detail view below, with a link to the page
Source appendix111Listed in the source appendix below
Only in the original0Not covered here; open the original PDF
Nothing here.
Detail views
Content the video only touches on, in full and with its place in the PDF.
Detail viewBackground: what was known before6
Context from the introduction that the video only touches on.
B-04Earlier modelling: limited cooling in tropical citiesBackgroundChecked Earlier energy-balance modelling showed that more urban vegetation has a limited cooling effect in tropical cities and differs between wet and dry climates.
B-05Land-cover studies miss the urban settingBackgroundChecked Studies of land-use change look at vegetation types but not at cities, so they miss regional differences for urban trees and treeless urban green spaces.
B-07ShadingBackgroundChecked Shading can strongly reduce daytime surface and air temperatures; the effect is larger over asphalt than grass and grows with leaf area index.
B-09Seasonality and dry regionsBackgroundChecked In dry regions, including parts of Southern Europe, summertime cooling by vegetation can be reduced because evapotranspiration is limited by soil moisture.
B-10Two opposing effects in heatwavesBackgroundChecked During hot extremes, higher surface resistance and a higher vapour pressure deficit pull in opposite directions, so vegetation can get relatively warmer or cooler.
B-11Are city trees like rural forests?BackgroundChecked City conditions can raise or lower tree cooling (CO2, nutrients, irrigation versus water stress, compacted soil, pollution), so it is unclear whether rural forests tell us about urban trees.
Detail viewStudy area, regions and maps3
Which cities and regions are covered and how maps and country means are built.
M-09Study domainMethodChecked Tree and land-cover data come from Copernicus for cities in the European Union and some additional countries, including Turkey.
M-11RegionsMethodUnclear Regional differences use a simplified division into European sub-areas, adding Turkey as a region and merging the Alps and Mid-Europe.
The text points to 'Fig. 3b' for the regions; the region map is panel b of Fig. 2. Fig. 3b shows rural vegetation boxplots by region.
M-33Maps and country meansMethodChecked Smooth spatial trends are computed with GAMs as an interpolation between cities; per country, differences are summarised by mean and standard error of the mean.
Detail viewTerrain and land-cover processing3
Predictors next to land cover, and how treeless green is separated.
M-12Elevation modelMethodChecked The digital elevation model EU-DEM v1.0 provides elevation as a predictor and is used to compute slope orientation (aspect).
M-13North- and south-facing slopesMethodChecked Aspect is reclassified into south-facing (90-270 degrees) and north-facing slopes; the fraction of north-facing slopes is computed per grid cell.
M-26Separating treeless green spacesMethodChecked Because tree cover is a separate layer, the models can estimate the signal of treeless green spaces even though the Urban Atlas does not distinguish tree-covered from treeless green spaces.
Detail viewSurface temperature retrieval and ASTER2
How emissivity is set and which second satellite data set was used for validation.
M-17Emissivity from vegetation coverFormulaChecked Emissivity is derived from NDVI in three steps: NDVI per cell, fraction of vegetation cover from NDVI, then emissivity as a linear combination between 0.97 (no vegetation) and 0.99 (full vegetation).
0.97 to 0.99 emissivity (dimensionless) · Surface emissivity used in the LST retrieval · Linear in the fraction of vegetation cover, which is estimated from NDVI
Given in words; the main article has no numbered equations.
M-20Second data set: ASTERMethodChecked ASTER surface temperatures (90 m, on the Terra satellite, about 30 minutes later than Landsat, on average 194 scenes per city) were used mainly for comparison and validation.
194 scenes per city (average) · ASTER scenes available per city · 90 m resolution; used for comparison and validation
Detail viewAlbedo and evapotranspiration data5
MODIS products, their resolution and their gaps.
M-21Albedo and evapotranspiration dataMethodChecked Albedo (MODIS MCD43A3, 500 m) and evapotranspiration (MODIS MYD16A2, 1 km) were averaged over 2006-2018 and attributed to land-cover types with multiple linear regression.
500 m (albedo), 1 km (ET) resolution · Spatial resolution of the MODIS products · Multi-year averages 2006-2018, aggregated per month and city
M-23Data gaps in the albedo/ET estimatesMethodChecked For small cities there is sometimes too little data; in three cities the models predicted negative evapotranspiration, which was discarded. MODIS products are validated but show potential biases.
R-21Albedo patternResultChecked The albedo of urban areas is highest in southern European regions and lowest over Scandinavia; forest albedo varies comparatively little.
FORM-2Regression line in Fig. 4bFormulaChecked Fitted line printed in Fig. 4b: y = 1.28 - 1.68 x, R2 = 0.54 (y: green-space-minus-urban-fabric difference in K, x: evapotranspiration of rural pastures in mm/day).
y = 1.28 - 1.68 x; R2 = 0.54 K per mm/day (slope) · Mean summertime LST difference treeless urban green spaces minus continuous urban fabric versus evapotranspiration of rural pastures · One point per city; mean summertime values
Printed inside the figure image, not in the text layer; read from the rendered page.
L-03Species-specific responses are not capturedLimitationChecked Species-specific responses to heat and drought overlay environmental effects in ways not directly captured by the MODIS evapotranspiration product used.
Detail viewStatistical model details6
Model terms, fit, sensitivity tests and what the model does not include.
M-27Smooth termsMethodChecked Coordinates enter as two-dimensional tensor product smooths, which reduces spatial autocorrelation; all other predictors are thin plate regression splines.
M-29Model fit and sensitivity testsMethodChecked Sensitivity experiments test the model set-up; 38 cities with unstable or non-significant tree effects were removed from that analysis. The fitted models average R2 = 0.64; it is lower in Turkey.
0.64 R2 (average) · Coefficient of determination of the fitted GAMs · Average over all cities; lower in Turkey (Supplementary Fig. 10)
M-31Background temperatureMethodChecked E-OBS (v20.0e) gridded air temperature is the indicator of background temperature; where it is unavailable (some cities in Turkey) the spatial average of each satellite observation is used.
L-07Spatial arrangement not fully removedLimitationChecked The approach tries to reduce the effect of how land-cover types are arranged in space, but it is unlikely that these effects were fully eliminated.
L-08Local Climate Zones as a complementLimitationChecked Analysing Local Climate Zones is an important approach for mixed urban land cover and may complement the separation approach used here.
L-11Urban form is not modelled directlyLimitationChecked Urban morphology and viewing-angle effects can bias observed temperatures and are not directly included; adding building height did not substantially change results in selected cities.
Detail viewMore regional results7
Finer regional findings, including urban versus rural vegetation.
R-15East-west gradient for rural forestsResultChecked Differences between rural forests and urban fabric show an east-west gradient: lower absolute values in Eastern than in Western Europe.
R-17Pastures cool much less than forestsResultChecked Absolute differences between rural pastures and urban fabric are much smaller than those between rural forests and urban fabric (Supplementary Fig. 1b).
R-19Trees versus green spaces by regionResultChecked The tree-minus-green-space difference is slightly higher in Central than in Southern European regions; the forest-minus-pasture difference is highest in the Mediterranean and Turkey.
R-27North: both vegetation types coolResultChecked In Scandinavia and over the British Isles, treeless urban green spaces and urban trees both provide substantial cooling.
R-35Scandinavia: urban trees cool more than rural forestsResultChecked In Central European regions and particularly Scandinavia, urban trees cool more than rural forests, possibly because factors that raise transpiration in cities outweigh those that reduce it.
R-36Turkey: urban trees cool less than rural forestsResultChecked In Turkey, cooling by urban trees is generally much lower than by rural forests, while treeless green spaces cool more than rural pastures - possibly an irrigation effect.
L-02Urban-versus-rural picture is still unclearLimitationChecked The authors say it is still very difficult to derive a clear picture of urban versus rural vegetation differences; high-resolution data on heat fluxes within cities would be needed.
Detail viewBiophysical explanations4
Stomata, roots and surface roughness.
R-38Stomata and heatResultChecked High temperatures could raise evapotranspiration through a high vapour pressure deficit, but transpirational cooling often drops considerably because trees reduce stomatal conductance; some species keep stomata open.
R-42Root depthResultChecked Trees have a larger root depth, which lets them use deeper soil moisture and sustain evapotranspiration when upper soil layers are dry.
R-43Surface roughnessResultChecked Rural forests are rough surfaces that convect heat efficiently; in cities, trees in street canyons can decrease or increase roughness depending on their height relative to buildings.
L-10Amount of vegetation differs between citiesLimitationChecked The overall amount of urban vegetation varies between cities in different regions, which may influence transpiration and the observed surface temperatures.
Detail viewOutlook: drying, irrigation and air temperature4
What the authors expect and what remains to be studied.
R-30Outlook: drying summersResultChecked Tree cooling decreases during hot extremes in many cities, particularly in Southern and Southeastern Europe; projected summer drying is likely to reduce vegetation benefits further, possibly also in regions with the highest cooling today.
R-31Irrigation and other measuresResultChecked Irrigation could help maintain cooling but may be limited by future water scarcity; this points to additional measures such as higher albedo of roofs and pavements.
L-15Surface and air temperature are still relatedLimitationChecked There are clear correlations between surface and air temperature, and surface data can be used to estimate air temperature, though with known inaccuracies, e.g. in complex terrain and in daytime.
L-16Next step: air temperature and wellbeingLimitationChecked To increase relevance, it will be important to understand how the surface temperature patterns translate into air temperature and other variables that affect wellbeing and energy use.
Source appendix
Figures, formulas, tables, references, data and supplements.
AppendixAll figures with captions5
Every figure of the main article. Figures are also explained in the chapters.
F-1Fig. 1 - Regional variation during hot extremesFigureChecked 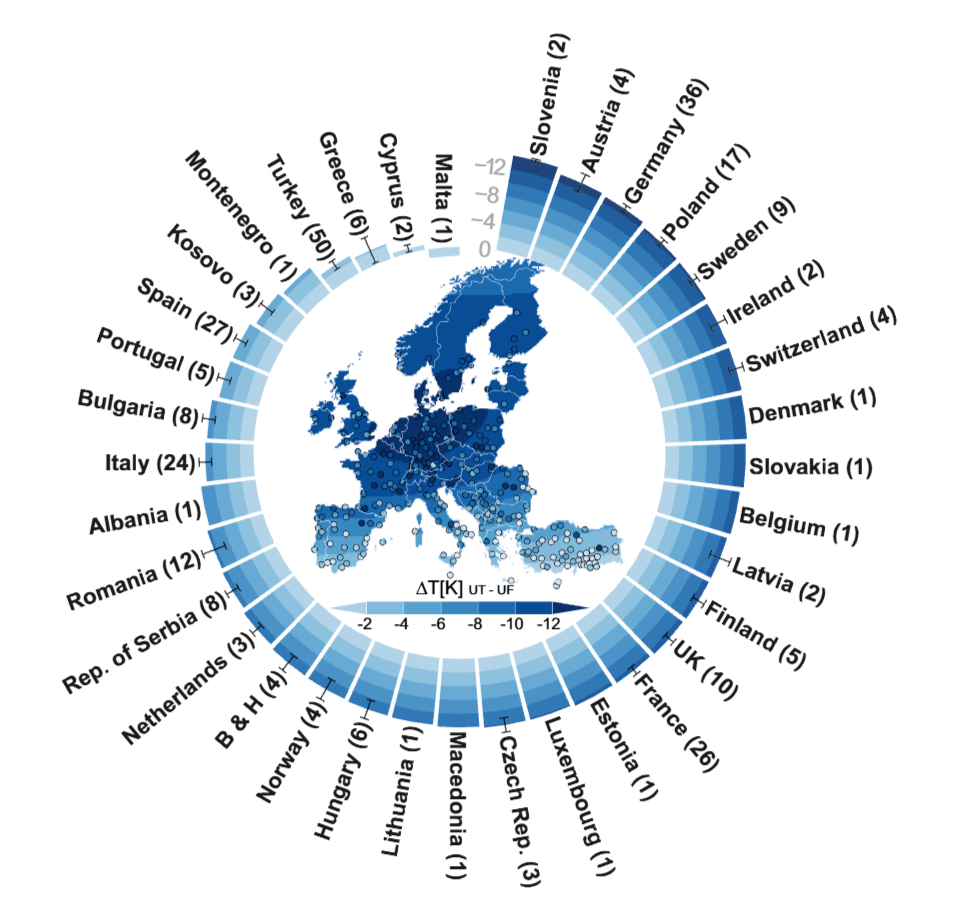
Map of smoothed temperature differences between 100% urban trees and 100% continuous urban fabric during hot extremes; dots are cities, the outer ring shows country means with standard errors and the number of cities per country.
F-2Fig. 2 - Selected cities, regions and seasonsFigureChecked 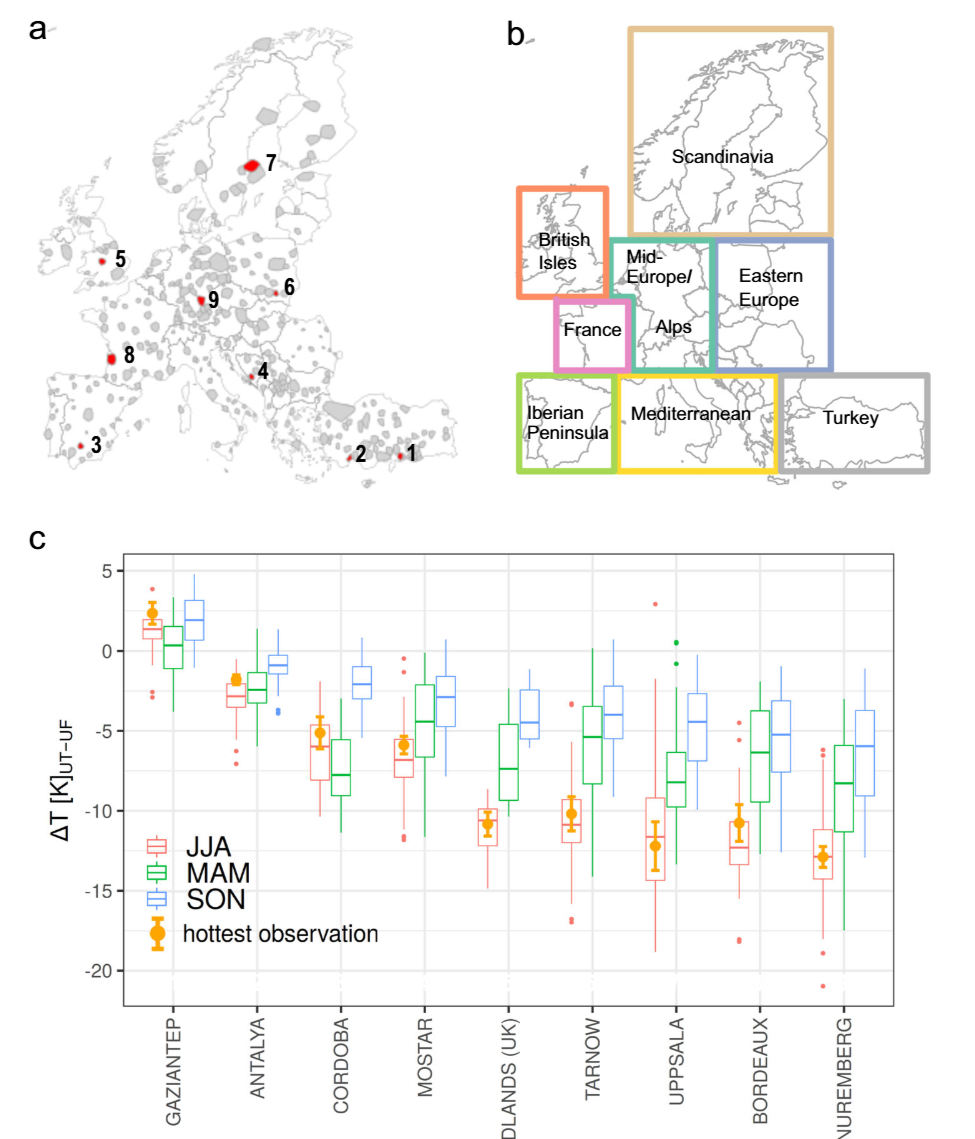
(a) All analysed cities and nine example cities, (b) the European regions used, (c) boxplots of tree-minus-urban-fabric differences per season for nine cities, with the hottest observation as an orange dot.
F-3Fig. 3 - Urban versus rural vegetation by regionFigureChecked 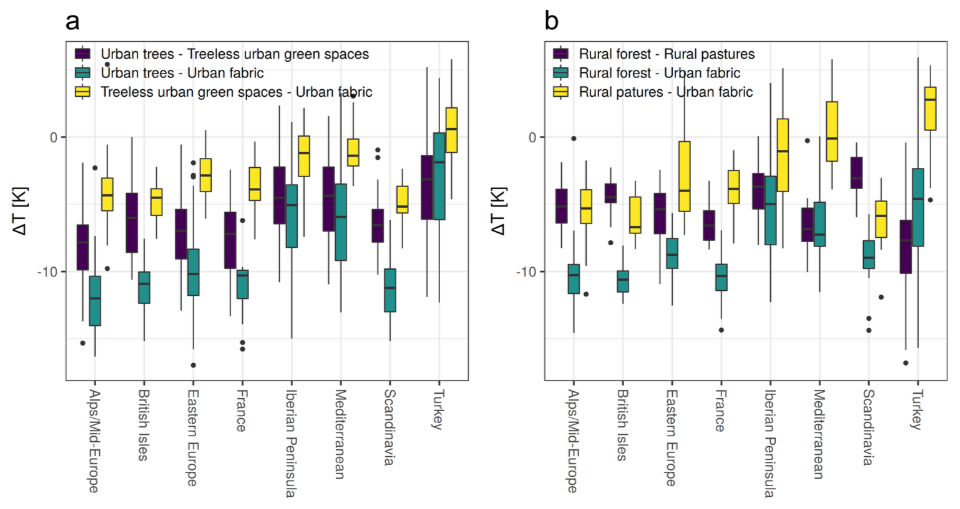
Boxplots per region of temperature differences between (a) urban vegetation and urban fabric and (b) rural vegetation and urban fabric.
F-4Fig. 4 - Temperature difference versus evapotranspirationFigureChecked 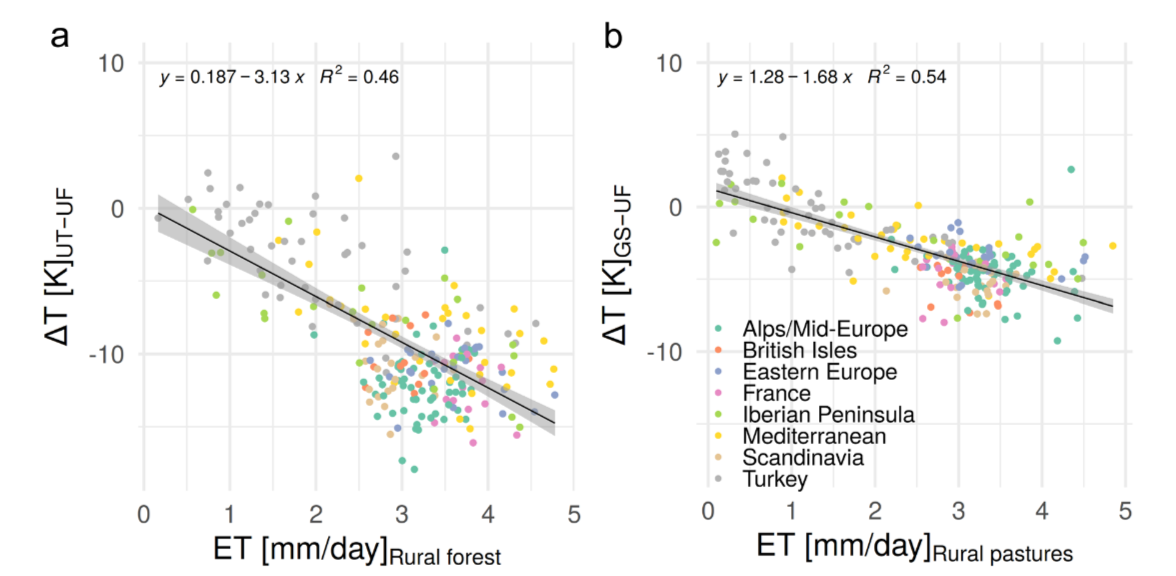
Scatterplots, one dot per city: (a) tree-minus-urban-fabric difference against evapotranspiration of rural forests, (b) green-space-minus-urban-fabric difference against evapotranspiration of rural pastures.
F-5Fig. 5 - Schematic of the modelling processFigureChecked 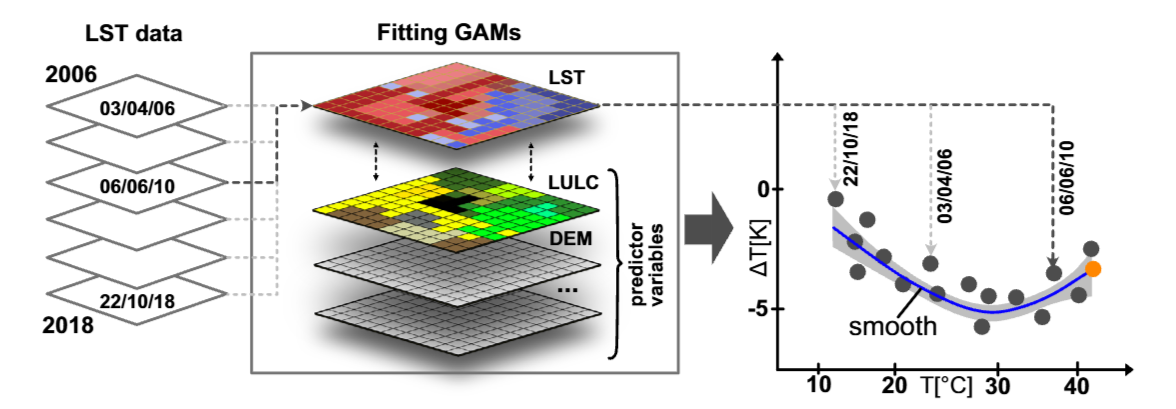
Surface temperature observations from 2006-2018 are the response in GAMs with several predictors; predicted differences are plotted against background temperature, and the smooth's value at the highest temperature (orange dot) is used to compare cities.
AppendixFormulas and tables4
The main article has no numbered equations and no tables. These are the formula-like statements it contains.
FORM-1Regression line in Fig. 4aFormulaChecked Fitted line printed in Fig. 4a: y = 0.187 - 3.13 x, R2 = 0.46 (y: tree-minus-urban-fabric difference in K, x: evapotranspiration of rural forest in mm/day).
y = 0.187 - 3.13 x; R2 = 0.46 K per mm/day (slope) · Mean summertime LST difference urban trees minus continuous urban fabric versus evapotranspiration of rural forest · One point per city; mean summertime values
Printed inside the figure image, not in the text layer; read from the rendered page.
FORM-2Regression line in Fig. 4bFormulaChecked Fitted line printed in Fig. 4b: y = 1.28 - 1.68 x, R2 = 0.54 (y: green-space-minus-urban-fabric difference in K, x: evapotranspiration of rural pastures in mm/day).
y = 1.28 - 1.68 x; R2 = 0.54 K per mm/day (slope) · Mean summertime LST difference treeless urban green spaces minus continuous urban fabric versus evapotranspiration of rural pastures · One point per city; mean summertime values
Printed inside the figure image, not in the text layer; read from the rendered page.
M-17Emissivity from vegetation coverFormulaChecked Emissivity is derived from NDVI in three steps: NDVI per cell, fraction of vegetation cover from NDVI, then emissivity as a linear combination between 0.97 (no vegetation) and 0.99 (full vegetation).
0.97 to 0.99 emissivity (dimensionless) · Surface emissivity used in the LST retrieval · Linear in the fraction of vegetation cover, which is estimated from NDVI
Given in words; the main article has no numbered equations.
T-01TablesTableChecked The main article contains no tables. Land-cover categories and model predictors are listed in Supplementary Tables 1 and 2, which are not part of this PDF.
Checked on all 11 pages: no table in the main article.
AppendixData and code availability3
D-01Data availability: results per cityData & codeChecked Per-city estimates of surface temperature differences, evapotranspiration and albedo are deposited on Zenodo: https://doi.org/10.5281/zenodo.5526674
D-02Data availability: input data sourcesData & codeChecked Landsat LST (rslab.gr), ASTER LST and MODIS (NASA Earthdata), EU-DEM v1.0 and the Urban Atlas with Street Tree Layer (Copernicus), E-OBS (ECA&D).
D-03Code availabilityData & codeChecked Code describing how the differences were calculated: https://zenodo.org/record/5526734
AppendixSupplementary material (external)4
Supplements are not part of the PDF. They are listed here with their own status and were not checked.
S-01Supplementary Figures 1-23SupplementExternal Cited in the article for, among others, treeless green spaces and pastures (1), rural forests (2, 3), albedo (4, 19), evapotranspiration (5), tree data coverage (6, 7), emissivity tests (8, 21), ASTER comparison (9), model fit (10-12), building height (15, 16), the northward shift (17) and LOESS curves (18).
Not part of the PDF. Available at the article page; not checked in this lesson.
S-02Supplementary Notes 1-6SupplementExternal Cited for the study domain (Note 1), model set-up sensitivity (Note 2), albedo approximation (Note 4), building height (Note 5) and selection of example cities (Note 6).
Not part of the PDF; not checked in this lesson.
S-03Supplementary Tables 1-2SupplementExternal Model predictors (Table 1) and Urban Atlas land-cover categories (Table 2).
Not part of the PDF; not checked in this lesson.
S-04Supplementary Data 1SupplementExternal List of the 293 cities with the number of Landsat scenes per city.
Not part of the PDF; not checked in this lesson.
AppendixArticle information and footnotes11
X-01Article titleArticle infoChecked The role of urban trees in reducing land surface temperatures in European cities, by Schwaab, Meier, Mussetti, Seneviratne, Bürgi and Davin. Nature Communications 12:6763 (2021).
X-02AffiliationFootnoteChecked All authors: Institute for Atmospheric and Climate Science, ETH Zurich, Switzerland. Corresponding author: Jonas Schwaab.
X-03Present address (E. L. Davin)FootnoteChecked Present address of Edouard L. Davin: Wyss Academy for Nature, Climate and Environmental Physics, Oeschger Centre for Climate Change Research, University of Bern.
X-04DOI and article numberArticle infoChecked Nature Communications (2021) 12:6763, DOI 10.1038/s41467-021-26768-w, open access.
X-05Received and acceptedArticle infoChecked Received 27 October 2020; accepted 20 October 2021.
X-06Acknowledgements and fundingArticle infoChecked Funded by the Swiss National Science Foundation and the Swiss Federal Office for the Environment through the CLIMPULSE project (grant no. 200021_172715).
X-07Author contributionsArticle infoChecked J.S. and E.L.D. conceptualised the study; J.S. conducted the analysis and wrote the manuscript with help from all authors.
X-08Competing interestsArticle infoChecked The authors declare no competing interests.
X-09Peer reviewArticle infoChecked Peer reviewer reports are available.
X-10Publisher's noteFootnoteChecked Springer Nature remains neutral with regard to jurisdictional claims in published maps and institutional affiliations.
X-11Licence: CC BY 4.0Article infoChecked Open access under a Creative Commons Attribution 4.0 International License: use, sharing, adaptation and reproduction are permitted with credit, a link to the licence and an indication of changes. Figures in this lesson are cropped from the original PDF.
AppendixReferences (1-84)84
The complete reference list, extracted from the PDF.
Ref. 1 Wang, X. H., Wu, Y., Gong, J., Li, B. & Zhao, J. J. Urban planning design and sustainable development of forest based on heat island effect. Appl. Ecol. Environ. Res. 17, 9121–9129 (2019).
Ref. 2 Manoli, G. et al. Magnitude of urban heat islands largely explained by climate and population. Nature 573, 55–60 (2019).
Ref. 3 Chakraborty, T. & Lee, X. A simplified urban-extent algorithm to characterize surface urban heat islands on a global scale and examine vegetation control on their spatiotemporal variability. Int. J. Appl. Earth Observation Geoinf. 74, 269–280 (2019).
Ref. 4 Martilli, A., Krayenhoff, E. S. & Nazarian, N. Is the Urban Heat Island intensity relevant for heat mitigation studies? Urban Clim. 31, 100541 (2020).
Ref. 5 Li, Y. et al. Local cooling and warming effects of forests based on satellite observations. Nat. Commun. 6, 6603 (2015).
Ref. 6 Duveiller, G., Hooker, J. & Cescatti, A. The mark of vegetation change on Earth’s surface energy balance. Nat. Commun. 9, 679 (2018).
Ref. 7 Silva, J. S., Silva, R. M. D. & Santos, C. A. G. Spatiotemporal impact of land use/land cover changes on urban heat islands: a case study of Paço do Lumiar, Brazil. Build. Environ. 136, 279–292 (2018).
Ref. 8 Winbourne, J. B. et al. Tree transpiration and urban temperatures: current understanding, implications, and future research directions. Bioscience 70, 576–588 (2020).
Ref. 9 Wang, C. H., Wang, Z. H. & Yang, J. C. Cooling effect of urban trees on the built environment of contiguous United States. Earth Future 6, 1066–1081 (2018).
Ref. 10 Rahman, M. A., Moser, A., Rotzer, T. & Pauleit, S. Comparing the transpirational and shading effects of two contrasting urban tree species. Urban Ecosyst. 22, 683–697 (2019).
Ref. 11 Rahman, M. A. et al. Traits of trees for cooling urban heat islands: a meta-analysis. Build. Environ. 170, 106606 (2020).
Ref. 12 Coutts, A. M., White, E. C., Tapper, N. J., Beringer, J. & Livesley, S. J. Temperature and human thermal comfort effects of street trees across three contrasting street canyon environments. Theor. Appl. Climatol. 124, 55–68 (2016).
Ref. 13 Smithers, R. J. et al. Comparing the relative abilities of tree species to cool the urban environment. Urban Ecosyst. 21, 851–862 (2018).
Ref. 14 Wang, C. H., Wang, Z. H., Wang, C. Y. & Myint, S. W. Environmental cooling provided by urban trees under extreme heat and cold waves in US cities. Remote Sens. Environ. 227, 28–43 (2019).
Ref. 15 Su, Y. et al. Phenology acts as a primary control of urban vegetation cooling and warming: a synthetic analysis of global site observations. Agric. For. Meteorol. 280, 107765 (2020).
Ref. 16 Meili, N. et al. Tree effects on urban microclimate: diurnal, seasonal, and climatic temperature differences explained by separating radiation, evapotranspiration, and roughness effects. Urban Forestry Urban Green. 58, 126970 (2021).
Ref. 17 Manoli, G., Fatichi, S., Bou-Zeid, E. & Katul, G. G. Seasonal hysteresis of surface urban heat islands. Proc. Natl Acad. Sci. USA 117, 7082 (2020).
Ref. 18 Wang, P., Li, D., Liao, W. L., Rigden, A. & Wang, W. Contrasting evaporative responses of ecosystems to heatwaves traced to the opposing roles of vapor pressure deficit and surface resistance. Water Resour. Res. 55, 4550–4563 (2019).
Ref. 19 Pataki, D. E., McCarthy, H. R., Litvak, E. & Pincetl, S. Transpiration of urban forests in the Los Angeles metropolitan area. Ecol. Appl. 21, 661–677 (2011).
Ref. 20 Mussetti, G. et al. COSMO-BEP-Tree v1.0: a coupled urban climate model with explicit representation of street trees. Geosci. Model Dev. 13, 1685–1710 (2020).
Ref. 21 Brondfield, M. N., Hutyra, L. R., Gately, C. K., Raciti, S. M. & Peterson, S. A. Modeling and validation of on-road CO2 emissions inventories at the urban regional scale. Environ. Pollut. 170, 113–123 (2012).
Ref. 22 Decina, S. M., Templer, P. H., Hutyra, L. R., Gately, C. K. & Rao, P. Variability, drivers, and effects of atmospheric nitrogen inputs across an urban area: emerging patterns among human activities, the atmosphere, and soils. Sci. Total Environ. 609, 1524–1534 (2017).
Ref. 23 Zipper, S. C., Schatz, J., Kucharik, C. J. & Loheide, S. P. II Urban heat island-induced increases in evapotranspirative demand. Geophys. Res. Lett. 44, 873–881 (2017).
Ref. 24 Reyes-Paecke, S., Gironas, J., Melo, O., Vicuna, S. & Herrera, J. Irrigation of green spaces and residential gardens in a Mediterranean metropolis: gaps and opportunities for climate change adaptation. Landsc. Urban Plan. 182, 34–43 (2019).
Ref. 25 Melaas, E. K., Wang, J. A., Miller, D. L. & Friedl, M. A. Interactions between urban vegetation and surface urban heat islands: a case study in the Boston metropolitan region. Environ. Res. Lett. 11, 054020 (2016).
Ref. 26 Chen, X. P., Zhou, Z. X., Teng, M. J., Wang, P. C. & Zhou, L. Accumulation of three different sizes of particulate matter on plant leaf surfaces: effect on leaf traits. Arch. Biol. Sci. 67, 1257–1267 (2015).
Ref. 27 Meineke, E., Youngsteadt, E., Dunn, R. R. & Frank, S. D. Urban warming reduces aboveground carbon storage. Proc. R. Soc. B Biol. Sci. 283, 20161574 (2016).
Ref. 28 Jim, C. Y. Soil volume restrictions and urban soil design for trees in confined planting sites. J. Landsc. Architecture 14, 84–91 (2019).
Ref. 29 Manickathan, L., Defraeye, T., Allegrini, J., Derome, D. & Carmeliet, J. Parametric study of the influence of environmental factors and tree properties on the transpirative cooling effect of trees. Agric. For. Meteorol. 248, 259–274 (2018).
Ref. 30 Christidis, N. & Stott, P. A. The influence of anthropogenic climate change on wet and dry summers in Europe. Sci. Bull. 66, 813–823 (2021).
Ref. 31 Pauleit, S. et al. Tree establishment practice in towns and cities – results from a European survey. Urban Forestry Urban Green. 1, 83–96 (2002).
Ref. 32 Tsiros, I. X. Assessment and energy implications of street air temperature cooling by shade tress in Athens (Greece) under extremely hot weather conditions. Renew. Energy 35, 1866–1869 (2010).
Ref. 33 Chrysoulakis, N. et al. Urban energy exchanges monitoring from space. Sci. Rep. 8, 11498 (2018).
Ref. 34 Denissen, J. M. C., Teuling, A. J., Reichstein, M. & Orth, R. Critical soil moisture derived from satellite observations over Europe. J. Geophys. Res. Atmos. 125, e2019JD031672 (2020).
Ref. 35 McAdam, S. A. M. & Brodribb, T. J. The evolution of mechanisms driving the stomatal response to vapor pressure deficit. Plant Physiol. 167, 833–843 (2015).
Ref. 36 Teskey, R. et al. Responses of tree species to heat waves and extreme heat events. Plant Cell Environ. 38, 1699–1712 (2015).
Ref. 37 De Kauwe, M. G. et al. Examining the evidence for decoupling between photosynthesis and transpiration during heat extremes. Biogeosciences 16, 903–916 (2019).
Ref. 38 Roman, D. T. et al. The role of isohydric and anisohydric species in determining ecosystem-scale response to severe drought. Oecologia 179, 641–654 (2015).
Ref. 39 Wang, L., Huang, M. & Li, D. Where are white roofs more effective in cooling the surface? Geophys. Res. Lett. 47, e2020GL087853 (2020).
Ref. 40 Davin, E. L., Seneviratne, S. I., Ciais, P., Olioso, A. & Wang, T. Preferential cooling of hot extremes from cropland albedo management. Proc. Natl Acad. Sci. USA 111, 9757–9761 (2014).
Ref. 41 Iio, A., Hikosaka, K., Anten, N. P. R., Nakagawa, Y. & Ito, A. Global dependence of field-observed leaf area index in woody species on climate: a systematic review. Glob. Ecol. Biogeogr. 23, 274–285 (2014).
Ref. 42 Paschalis, A., Chakraborty, T., Fatichi, S., Meili, N. & Manoli, G. Urban forests as main regulator of the evaporative cooling effect in cities. AGU Adv. 2, e2020AV000303 (2021).
Ref. 43 Teuling, A. J. et al. Contrasting response of European forest and grassland energy exchange to heatwaves. Nat. Geosci. 3, 722–727 (2010).
Ref. 44 Yosef, G. et al. Large-scale semi-arid afforestation can enhance precipitation and carbon sequestration potential. Sci. Rep. 8, 996 (2018).
Ref. 45 Burakowski, E. et al. The role of surface roughness, albedo, and Bowen ratio on ecosystem energy balance in the Eastern United States. Agric. For. Meteorol. 249, 367–376 (2018).
Ref. 46 Schenk, H. J. & Jackson, R. B. The global biogeography of roots. Ecol. Monogr. 72, 311–328 (2002).
Ref. 47 Rotenberg, E. & Yakir, D. Contribution of semi-arid forests to the climate system. Science 327, 451–454 (2010).
Ref. 48 Giometto, M. G. et al. Effects of trees on mean wind, turbulence and momentum exchange within and above a real urban environment. Adv. Water Resour. 106, 154–168 (2017).
Ref. 49 Zhao, L., Lee, X., Smith, R. B. & Oleson, K. Strong contributions of local background climate to urban heat islands. Nature 511, 216–219 (2014).
Ref. 50 Li, D. et al. Urban heat island: aerodynamics or imperviousness? Sci. Adv. 5, eaau4299 (2019).
Ref. 51 Schwaab, J. et al. Increasing the broad-leaved tree fraction in European forests mitigates hot temperature extremes. Sci. Rep. 10, 14153 (2020).
Ref. 52 Parastatidis, D., Mitraka, Z., Chrysoulakis, N. & Abrams, M. Online global land surface temperature estimation from Landsat. Remote Sens. 9, 16 (2017).
Ref. 53 Zhou, W., Huang, G. & Cadenasso, M. L. Does spatial configuration matter? Understanding the effects of land cover pattern on land surface temperature in urban landscapes. Landsc. Urban Plan. 102, 54–63 (2011).
Ref. 54 Schwarz, N. & Manceur, A. M. Analyzing the influence of urban forms on surface urban heat islands in Europe. J. Urban Plan. Dev. 14, A4014003 (2015).
Ref. 55 Bechtel, B. et al. SUHI analysis using Local Climate Zones—a comparison of 50 cities. Urban Clim. 28, 100451 (2019).
Ref. 56 Hu, L., Monaghan, A., Voogt, J. A. & Barlage, M. A first satellite-based observational assessment of urban thermal anisotropy. Remote Sens. Environ. 181, 111–121 (2016).
Ref. 57 Martilli, A. et al. Summer average urban-rural surface temperature differences do not indicate the need for urban heat reduction. OSF Preprint at https:// doi.org/10.31219/osf.io/8gnbf (2020).
Ref. 58 Manoli, G. et al. Reply to Martilli et al. (2020): Summer average urban-rural surface temperature differences do not indicate the need for urban heat reduction. OSF Preprint at https://doi.org/10.31219/osf.io/mwpna (2020).
Ref. 59 Chakraborty, T., Hsu, A., Manya, D. & Sheriff, G. A spatially explicit surface urban heat island database for the United States: characterization, uncertainties, and possible applications. ISPRS J. Photogramm. Remote Sens. 168, 74–88 (2020).
Ref. 60 Zhang, P., Bounoua, L., Imhoff, M. L., Wolfe, R. E. & Thome, K. Comparison of MODIS land surface temperature and air temperature over the continental USA meteorological stations. Can. J. Remote Sens. 40, 110–122 (2014).
Ref. 61 Good, E. J. An in situ-based analysis of the relationship between land surface “skin” and screen-level air temperatures. J. Geophys. Res. Atmos. 121, 8801–8819 (2016).
Ref. 62 Mildrexler, D. J., Zhao, M. & Running, S. W. A global comparison between station air temperatures and MODIS land surface temperatures reveals the cooling role of forests. J. Geophys. Res. Biogeosci. https://doi.org/10.1029/ 2010JG001486 (2011).
Ref. 63 Novick, K. A. & Katul, G. G. The duality of reforestation impacts on surface and air temperature. J. Geophys. Res. Biogeosci. 125, e2019JG005543 (2020).
Ref. 64 Hu, Y. et al. Comparison of surface and canopy urban heat islands within megacities of eastern China. ISPRS J. Photogramm. Remote Sens. 156, 160–168 (2019).
Ref. 65 Hooker, J., Duveiller, G. & Cescatti, A. A global dataset of air temperature derived from satellite remote sensing and weather stations. Sci. Data 5, 180246 (2018).
Ref. 66 Serra, C. et al. Air temperature in Barcelona metropolitan region from MODIS satellite and GIS data. Theor. Appl. Climatol. 139, 473–492 (2020).
Ref. 67 Benali, A., Carvalho, A. C., Nunes, J. P., Carvalhais, N. & Santos, A. Estimating air surface temperature in Portugal using MODIS LST data. Remote Sens. Environ. 124, 108–121 (2012).
Ref. 68 Kloog, I., Chudnovsky, A., Koutrakis, P. & Schwartz, J. Temporal and spatial assessments of minimum air temperature using satellite surface temperature measurements in Massachusetts, USA. Sci. Total Environ. 432, 85–92 (2012).
Ref. 69 Alonso, L. & Renard, F. A new approach for understanding urban microclimate by integrating complementary predictors at different scales in regression and machine learning models. Remote Sens. 12, 35 (2020).
Ref. 70 Mutiibwa, D., Strachan, S. & Albright, T. Land surface temperature and surface air temperature in complex terrain. IEEE J. Sel. Top. Appl. Earth Observations Remote Sens. 8, 4762–4774 (2015).
Ref. 71 Ho, H. C., Knudby, A., Xu, Y., Hodul, M. & Aminipouri, M. A comparison of urban heat islands mapped using skin temperature, air temperature, and apparent temperature (Humidex), for the greater Vancouver area. Sci. Total Environ. 544, 929–938 (2016).
Ref. 72 Christensen, J. H. & Christensen, O. B. A summary of the PRUDENCE model projections of changes in European climate by the end of this century. Clim. Change 81, 7–30 (2007).
Ref. 73 EEA. EU-DEM Statistical Validation (EEA, 2014).
Ref. 74 European Commission. Mapping Guide v4.7 for a European Urban Atlas. https://land.copernicus.eu/user-corner/technical-library/urban-atlas-2012-mapping-guide-new/ (2012).
Ref. 75 Carlson, T. N. & Ripley, D. A. On the relation between NDVI, fractional vegetation cover, and leaf area index. Remote Sens. Environ. 62, 241–252 (1997).
Ref. 76 Gillespie, A. et al. A temperature and emissivity separation algorithm for Advanced Spaceborne Thermal Emission and Reflection Radiometer (ASTER) images. IEEE Trans. Geosci. Remote Sens. 36, 1113–1126 (1998).
Ref. 77 Schaaf, C. & Wang, Z. MCD43A3 MODIS/Terra+Aqua BRDF/Albedo Daily L3 Global - 500 m V006, distributed by NASA EOSDIS Land Processes DAAC. https://doi.org/10.5067/MODIS/MCD43A3.006 (2015).
Ref. 78 Running, S., Mu, Q. & Zhao, M. MYD16A2 MODIS/Aqua Net evapotranspiration 8-day l4 global 500m SIN grid V006. 2017, distributed by NASA EOSDIS Land Processes DAAC. https://doi.org/10.5067/MODIS/ MYD16A2.006 (2017).
Ref. 79 Cescatti, A. et al. Intercomparison of MODIS albedo retrievals and in situ measurements across the global FLUXNET network. Remote Sens. Environ. 121, 323–334 (2012).
Ref. 80 Wood, S. N. Generalized Additive Models: An Introduction with R 2nd edn. (CRC Press/Taylor & Francis Group, 2017).
Ref. 81 R Core Team. R: A Language and Environment for Statistical Computing (R Foundation for Statistical Computing, 2019).
Ref. 82 Beale, C. M., Lennon, J. J., Yearsley, J. M., Brewer, M. J. & Elston, D. A. Regression analysis of spatial data. Ecol. Lett. 13, 246–264 (2010).
Ref. 83 Cornes, R. C., van der Schrier, G., van den Besselaar, E. J. M. & Jones, P. D. An Ensemble version of the E-OBS temperature and precipitation data sets. J. Geophys. Res. Atmos. 123, 9391–9409 (2018).
Ref. 84 Cleveland, W. S., Grosse, E. & Shyu, W. M. Local regression models In: Statistical Models in S (eds Chambers, J. M. & Hastie, T. J.) 309–376 (Wadsworth & Brooks/Cole, 1992).